Principal Components Analysis of Wine Data from Kaggle
Project for class (DS2100, "Math for Data Science")
Research question: is there any chemical basis for wine ratings?
Data set found on Kaggle, contains 12 chemical properties of 1599 wines (predictors) and 1 outcome (wine rating).
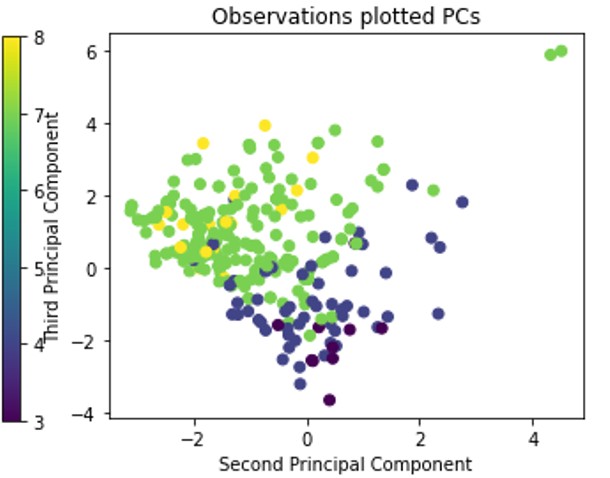
With PCA, we were able to explain 60% of the variance with just 3 components. In particular, a plot of wines on the second and third components shows good separation between wines with high ratings (yellow, green) and wines with low ratings (blue, purple).
Here is a Jupyter Notebook showing some of the code I used in the analysis.
Original data set from: https://archive.ics.uci.edu/ml/datasets/wine+quality P. Cortez A. Cerdeira F. Almeida T. Matos and J. Reis. Modeling wine preferences by data mining from physicochemical properties. Decision Support Systems 47(4):547-553 2009.